GitHub graph visualization using Gephi
This is the second part of this post where I describe how to fetch user and repository data directly from GitHub.
In this part, we are going to try to plot a graph that represents a part of GitHub using Gephi.
Prerequisite
I used the Python package relative to this post to exploit APIs, as described in the first part. (see this example)
But because Gephi mainly uses csv files has input, you are quite free to use the method of your choice if you want to reproduce some parts of this analysis.
Dataset
Description
Using the GitHub REST API, I fetched the 15,000 first repositories returned by the REST API and all their contributors, what represents 12,397 users and 42,083 contributions.
All those results are stored in 3 .csv files, with the following fields :
- repositories.csv
- id
- full_name
- users.csv
- id
- login
- contributions.csv
- id_repository
- id_user
- contributions (number of contributions by this user to this repository)
Those data (from REST, including cleaned data, and from GraphQL, are available in the examples/datasets folder.
Gephi input
However, Gephi can’t really take those three csv as direct input, at least for what we want to do. Instead, it’s better to convert them into 2 csv with the following characteristics :
- nodes.csv
- id
- label (in our case, users’ login and repositories’ full names)
- type (user or repository)
- edges.csv
- Source (user id)
- Target (repositorie id)
- Weight (our previous contributions field)
Obviously I performed all those conversions using Python, and you can do the same using my package if you want.
An important things is that to be able to perform operations (such as coloring for example) on nodes of different type using Gephi, they all need to be in the same file with a “type” attribute that you will use to distinguish nodes. The problem is that to make this work, we need to convert users and repositories id to ensure that all the final ids in the final file are unique, and convert the contributions accordingly in the final edges.csv file. One more time, Python will be your friend, but do not hesitate to check my code if you need help.
Data cleaning
If we tried to put this original dataset into Gephi, we would have 27,397 nodes and 42,083 to process. Actually, that’s quite big for Gephi, and anyway there are a lot of insignificant data in this dataset.
So what I did is that I removed all the users that have contributed to less than 100 repositories, and removed all the repositories with less than 10 contributors, and then we also removed all nodes that left without connections after those operations.
Actually that’s quite arbitrary, but you are free to test different parameters to try different cleaning if you want. ;-) Distributions plots that I implemented can also help you. (see an example to plot distributions and clean data just there
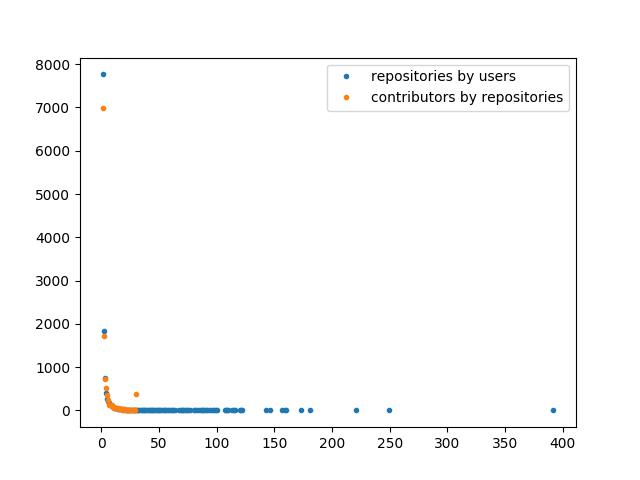
Anyway, I finally obtained 537 nodes for 2,023 connections, what is more reasonable.
Using Gephi
I’m not going to detail all the steps I performed to reach my final graph, because I basically just followed this very good tutorial by Martin Grandjean that will help you start with Gephi.
Once you have the good .csv files, you actually just need to play with the parameters until reaching a pretty graph. ;-)
And so, finally HERE IS MINE!!!
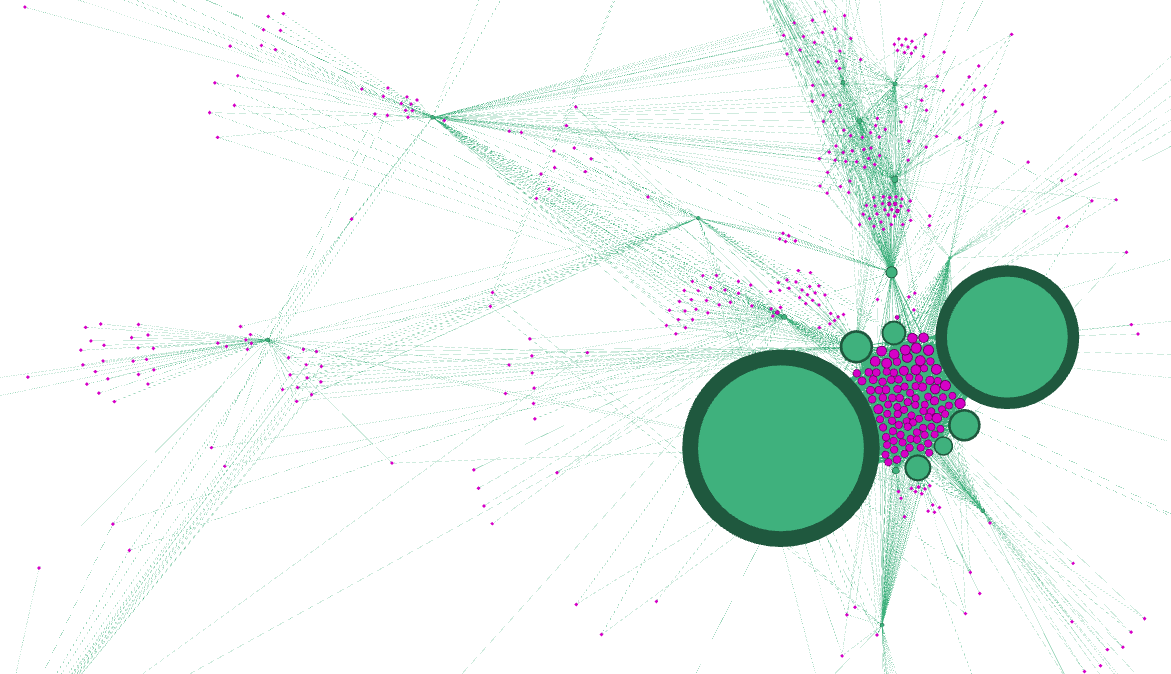
OK, it’s not that pretty. But it is actually quite interesting!
Green nodes are users, purples are repositories, and the size of nodes depends on the contributions weights. But what could be this big cluster at the center???
Let’s add labels to the graph:
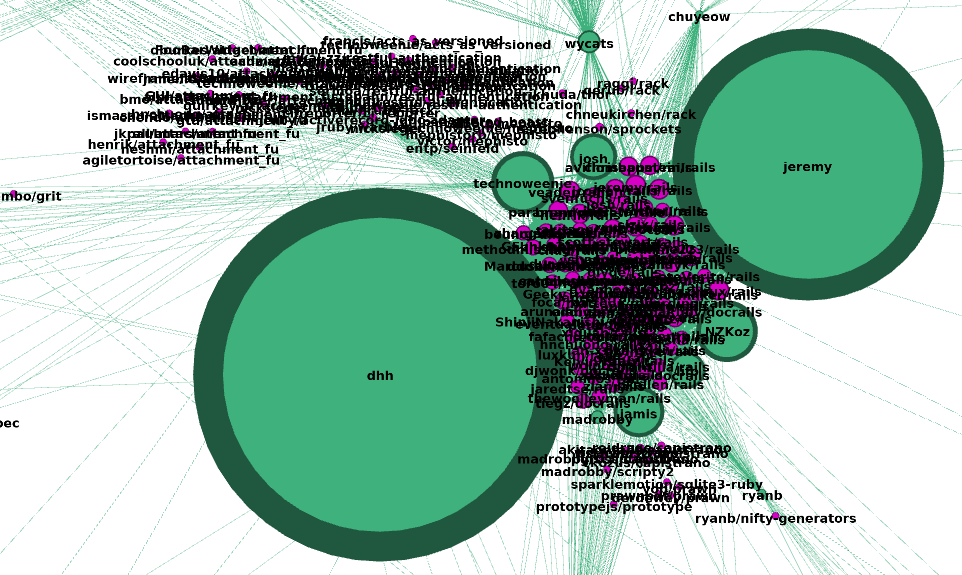
Let’s check who can be that dhh with its thousands of contributions… -> https://dhh.dk/
“I am the creator of Ruby On Rails”
Oh, really?? :open_mouth: Indeed, if we have a closer look at the repository cluster, we can see that they are nearly all rails repository forks! Also, jeremy , the other big node, is actually also a big rails contributor. So this graph is actually quite relevant.
Conclusion
My results finally only focus on the “first” 15,000 GitHub repositories, what is absolutely nothing considering the nearly 40,000,000 repositories…
Anyway, it would not be possible and even not interesting to fetch ALL GitHub’s data and to try to display it in Gephi… But I consider this project as a great proof of concept of what could be done using GitHub’s API and graph visualization, because actually I think it could be really interesting to use the same concepts to expand the graph from a particular user or repository (what would this time perfectly fit with the REST or GraphQL APIs use cases!) to visualize important contributions and dependencies using Gephi, what could (on top of satisfying our own curiosities) help to organize development strength around projects and users.
So I am finally done with this article! Thanks for reading me, and do not hesitate to contribute or contact me if you have some ideas! :wink: